Barycenter of Gaussian Distributions in \(\mathbb{R}^p\)
gaussbarypd.RdGiven a collection of \(n\)-dimensional Gaussian distributions \(N(\mu_i, \Sigma_i)\) for \(i=1,\ldots,n\), compute the Wasserstein barycenter of order 2. For the barycenter computation of variance components, we use a fixed-point algorithm by Álvarez-Esteban et al. (2016) .
Arguments
- means
an \((n\times p)\) matrix whose rows are mean vectors.
- vars
a \((p\times p\times n)\) array where each slice is covariance matrix.
- weights
a weight of each image; if
NULL(default), uniform weight is set. Otherwise, it should be a length-\(n\) vector of nonnegative weights.- ...
extra parameters including
- abstol
stopping criterion for iterations (default: 1e-8).
- maxiter
maximum number of iterations (default: 496).
Value
a named list containing
- mean
a length-\(p\) vector for mean of the estimated barycenter distribution.
- var
a \((p\times p)\) matrix for variance of the estimated barycenter distribution.
References
Álvarez-Esteban PC, del Barrio E, Cuesta-Albertos JA, Matrán C (2016). “A Fixed-Point Approach to Barycenters in Wasserstein Space.” Journal of Mathematical Analysis and Applications, 441(2), 744–762. ISSN 0022247X, doi:10.1016/j.jmaa.2016.04.045 .
Examples
# \donttest{
#----------------------------------------------------------------------
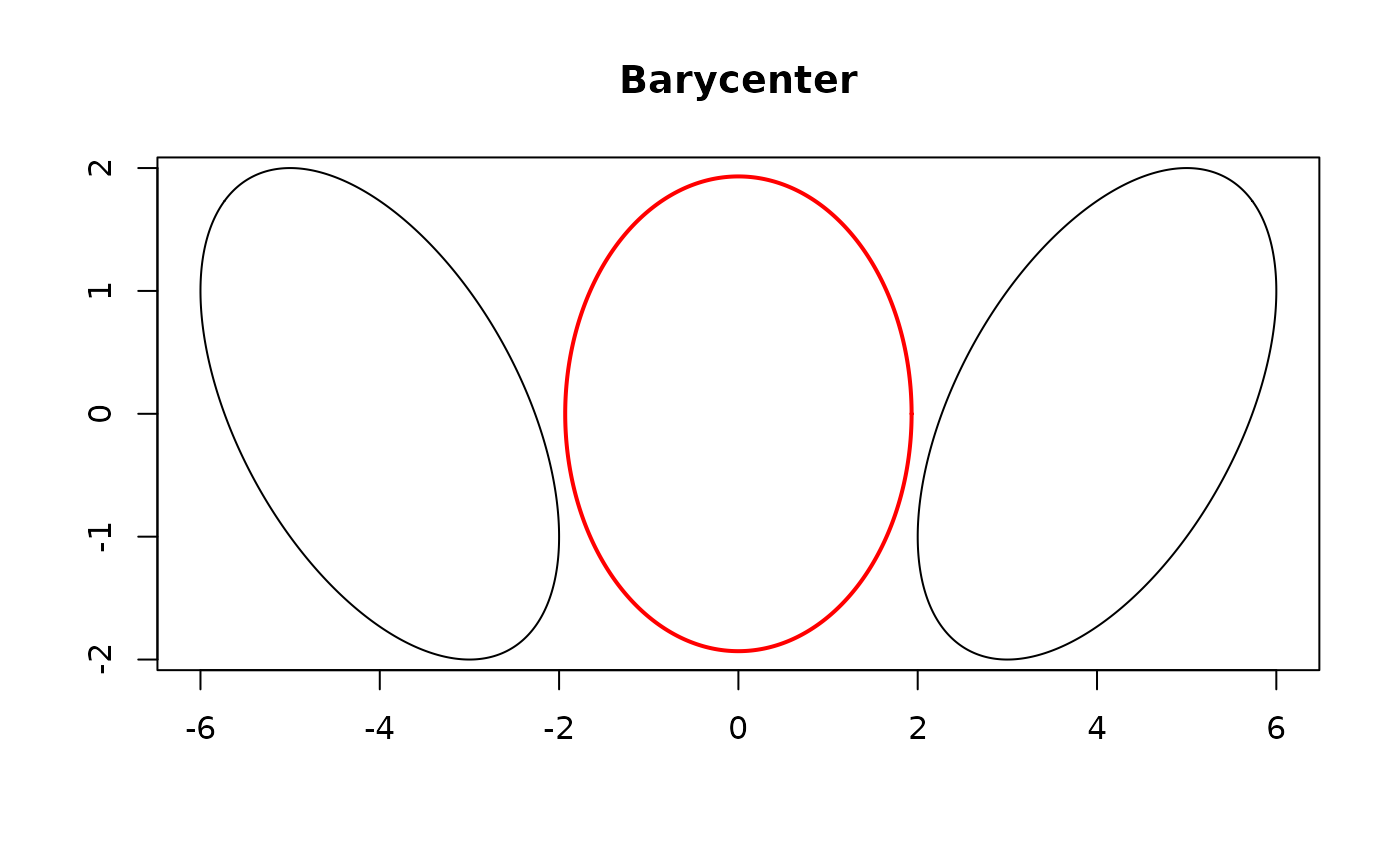
# Two Gaussians in R^2
#----------------------------------------------------------------------
# GENERATE PARAMETERS
# means
par_mean = rbind(c(-4,0), c(4,0))
# covariances
par_vars = array(0,c(2,2,2))
par_vars[,,1] = cbind(c(4,-2),c(-2,4))
par_vars[,,2] = cbind(c(4,+2),c(+2,4))
# COMPUTE THE BARYCENTER OF EQUAL WEIGHTS
gmean = gaussbarypd(par_mean, par_vars)
# GET COORDINATES FOR DRAWING
pt_type1 = gaussvis2d(par_mean[1,], par_vars[,,1])
pt_type2 = gaussvis2d(par_mean[2,], par_vars[,,2])
pt_gmean = gaussvis2d(gmean$mean, gmean$var)
# VISUALIZE
opar <- par(no.readonly=TRUE)
plot(pt_gmean, lwd=2, col="red", type="l",
main="Barycenter", xlab="", ylab="",
xlim=c(-6,6))
lines(pt_type1)
lines(pt_type2)
 par(opar)
# }
par(opar)
# }