Given \(N\) observations \(X_1, X_2, \ldots, X_N \in \mathcal{M}\) and
corresponding label information, riem.rmml computes pairwise distance of data under Riemannian Manifold Metric Learning
(RMML) framework based on equivariant embedding. When the number of data points
is not sufficient, an inverse of scatter matrix does not exist analytically so
the small regularization parameter \(\lambda\) is recommended with default value of \(\lambda=0.1\).
Arguments
- riemobj
a S3
"riemdata"class for \(N\) manifold-valued data.- label
a length-\(N\) vector of class labels.
NAvalues are omitted.- lambda
regularization parameter. If \(\lambda \leq 0\), no regularization is applied.
- as.dist
logical; if
TRUE, it returnsdistobject, else it returns a symmetric matrix.
Value
a S3 dist object or symmetric matrix of pairwise distances for
the observations with nonmissing labels, in their original order, according
to as.dist. At least two labeled observations are required.
Details
Embedding dimensions are determined from the manifold's actual equivariant embedding. In particular, a Grassmann frame is represented by its full orthogonal projector, so the result is unchanged by a change of basis within each represented subspace.
Validation status
This retained legacy interface is experimental. Its full numerical and
statistical contract has not been independently verified across supported
inputs. See riem-method-contracts and the installed contract
table for method-specific assumptions, restrictions, and evidence scope.
References
Zhu P, Cheng H, Hu Q, Wang Q, Zhang C (2018). “Towards Generalized and Efficient Metric Learning on Riemannian Manifold.” In Proceedings of the Twenty-Seventh International Joint Conference on Artificial Intelligence, 3235–3241. ISBN 978-0-9992411-2-7.
Examples
#-------------------------------------------------------------------
# Distance between Two Classes of SPD Matrices
#
# Class 1 : Empirical Covariance from Standard Normal Distribution
# Class 2 : Empirical Covariance from Perturbed 'iris' dataset
#-------------------------------------------------------------------
## DATA GENERATION
data(iris)
ndata = 10
mydata = list()
for (i in 1:ndata){
mydata[[i]] = stats::cov(matrix(rnorm(100*4),ncol=4))
}
for (i in (ndata+1):(2*ndata)){
tmpdata = as.matrix(iris[,1:4]) + matrix(rnorm(150*4,sd=0.5),ncol=4)
# This matrix-entry demonstration uses positional coordinates in both groups.
mydata[[i]] = unname(stats::cov(tmpdata))
}
myriem = wrap.spd(mydata)
mylabs = rep(c(1,2), each=ndata)
## COMPUTE GEODESIC AND RMML PAIRWISE DISTANCE
pdgeo = riem.pdist(myriem)
pdmdl = riem.rmml(myriem, label=mylabs)
## VISUALIZE
opar = par(no.readonly=TRUE)
par(mfrow=c(1,2), pty="s")
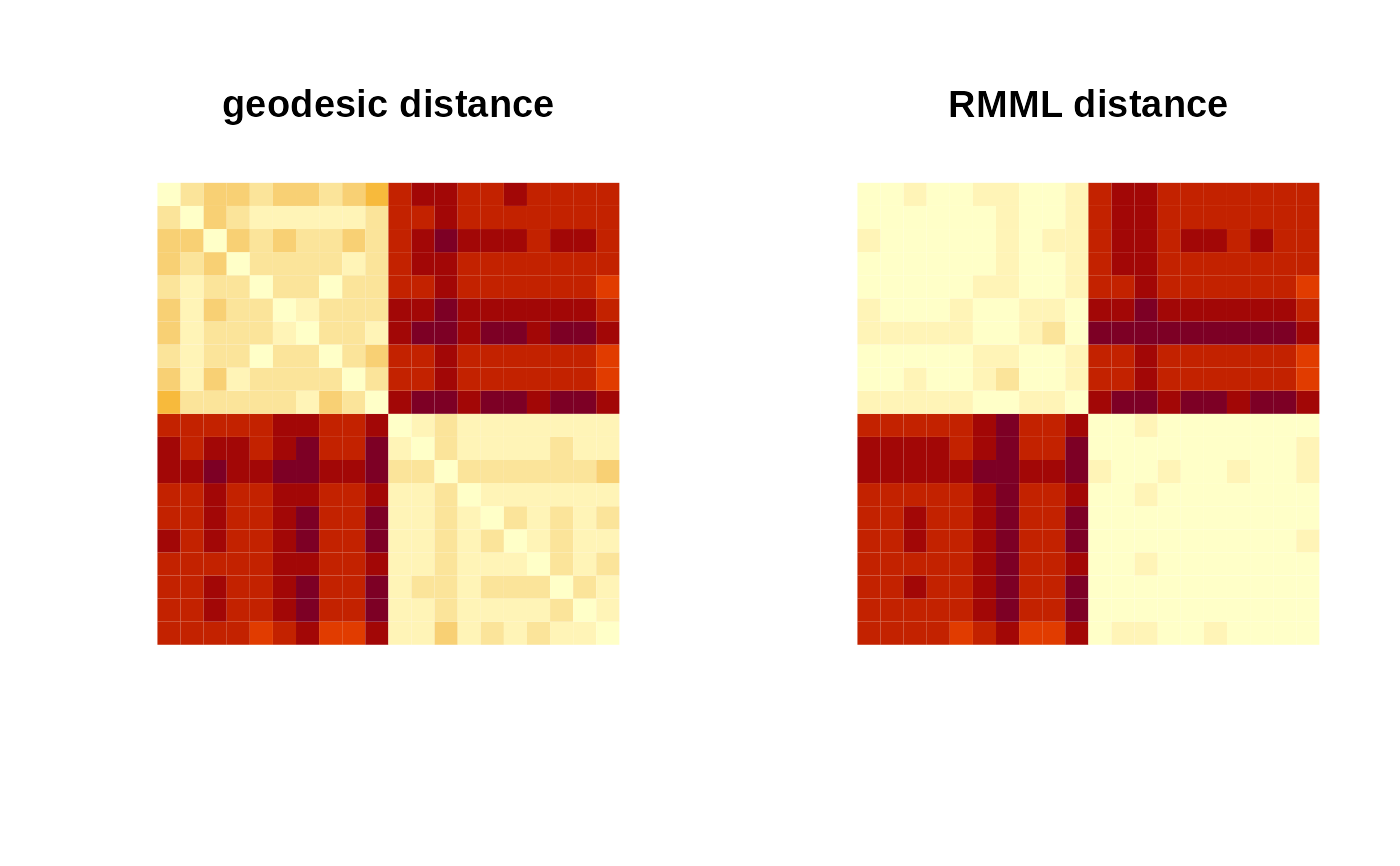
image(pdgeo[,(2*ndata):1], main="geodesic distance", axes=FALSE)
image(pdmdl[,(2*ndata):1], main="RMML distance", axes=FALSE)
 par(opar)