
Given 2 observations \(X_1, X_2 \in \mathcal{M}\), find the interpolated points of a geodesic \(\gamma(t)\) for \(t \in (0,1)\) which assumes two endpoints \(\gamma(0)=X_1\) and \(\gamma(1)=X_2\).
Value
a 3d array where \(T\) slices along 3rd dimension are interpolated objects in matrix representation.
Validation status
This retained legacy interface is experimental. Its full numerical and
statistical contract has not been independently verified across supported
inputs. See riem-method-contracts and the installed contract
table for method-specific assumptions, restrictions, and evidence scope.
Examples
#-------------------------------------------------------------------
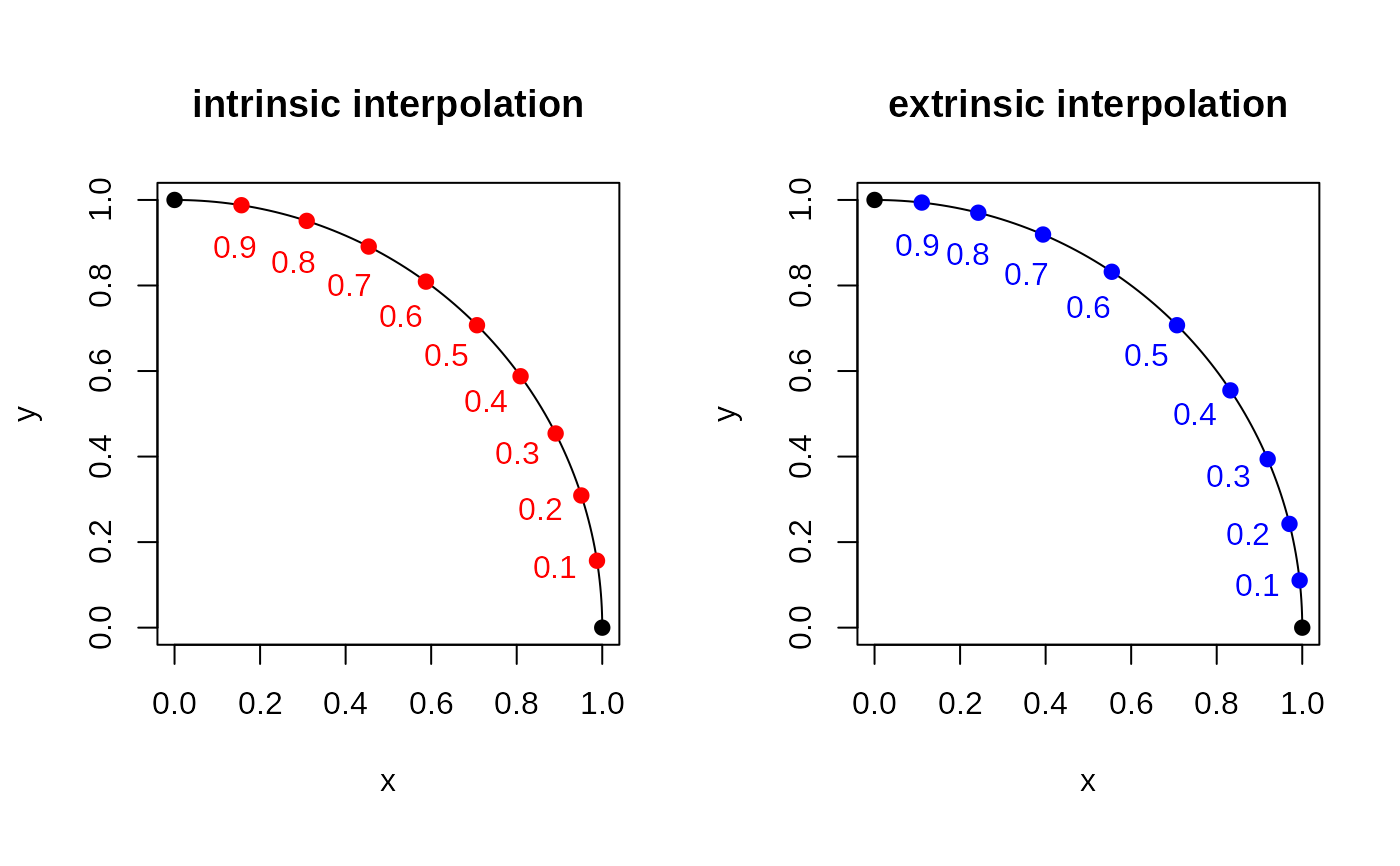
# Geodesic Interpolation between (1,0) and (0,1) in S^1
#-------------------------------------------------------------------
## PREPARE DATA
sp.start = c(1,0)
sp.end = c(0,1)
sp.data = wrap.sphere(rbind(sp.start, sp.end))
## FIND THE INTERPOLATED POINT AT FOR t=0.1, 0.2, ..., 0.9.
myvect = seq(from=0.1, to=0.9, by=0.1)
geo.int = riem.interps(sp.data, vect=myvect, geometry="intrinsic")
geo.ext = riem.interps(sp.data, vect=myvect, geometry="extrinsic")
geo.int = matrix(geo.int, byrow=TRUE, ncol=2) # re-arrange for plotting
geo.ext = matrix(geo.ext, byrow=TRUE, ncol=2)
## VISUALIZE
# Prepare Lines and Points
thetas = seq(from=0, to=pi/2, length.out=100)
quarter = cbind(cos(thetas), sin(thetas))
pts.int = rbind(sp.start, geo.int, sp.end)
pts.ext = rbind(sp.start, geo.ext, sp.end)
col.int = c("black", rep("red",9), "black")
col.ext = c("black", rep("blue",9), "black")
# Draw
opar <- par(no.readonly=TRUE)
par(mfrow=c(1,2), pty="s")
plot(quarter, main="intrinsic interpolation", # intrinsic geodesic
xlab="x", ylab="y", type="l")
points(pts.int, col=col.int, pch=19)
for (i in 1:9){
text(geo.int[i,1]*0.9, geo.int[i,2]*0.9,
paste0(round(i/10,2)), col="red")
}
plot(quarter, main="extrinsic interpolation", # intrinsic geodesic
xlab="x", ylab="y", type="l")
points(pts.ext, col=col.ext, pch=19)
for (i in 1:9){
text(geo.ext[i,1]*0.9, geo.ext[i,2]*0.9,
paste0(round(i/10,2)), col="blue")
}
 par(opar)