Given \(N\) observations \(X_1, X_2, \ldots, X_M \in \mathcal{M}\),
perform hierarchical agglomerative clustering with
stats::hclust. The supplied manifold distances are treated as dissimilarities.
Usage
riem.hclust(
  riemobj,
  geometry = NULL,
  method = c("single", "complete", "average", "mcquitty", "ward.D", "ward.D2",
    "centroid", "median"),
  members = NULL
)
Arguments
- riemobj
a S3
"riemdata"class for \(N\) manifold-valued data.- geometry
A geometry name or saved specification.
- method
agglomeration method to be used. This must be one of
"single","complete","average","mcquitty","ward.D","ward.D2","centroid"or"median".- members
NULLor a vector whose length equals the number of observations. Seehclustfor details.
Value
an object of class hclust. See hclust for details.
Details
Ward, centroid and median linkage require care when interpreted as
Euclidean sums of squares. In particular, Ward linkage of geodesic distances
is not manifold k-means. ward.D is the historical R update and does
not implement the Ward criterion implemented by ward.D2. See the
stats::hclust documentation for distance powers and member weights.
References
Müllner D (2013). “fastcluster : Fast Hierarchical, Agglomerative Clustering Routines for R and Python.” Journal of Statistical Software, 53(9). ISSN 1548-7660.
Examples
#-------------------------------------------------------------------
# Example on Sphere : a dataset with three types
#
# class 1 : 10 perturbed data points near (1,0,0) on S^2 in R^3
# class 2 : 10 perturbed data points near (0,1,0) on S^2 in R^3
# class 3 : 10 perturbed data points near (0,0,1) on S^2 in R^3
#-------------------------------------------------------------------
## GENERATE DATA
mydata = list()
for (i in 1:10){
tgt = c(1, stats::rnorm(2, sd=0.1))
mydata[[i]] = tgt/sqrt(sum(tgt^2))
}
for (i in 11:20){
tgt = c(rnorm(1,sd=0.1),1,rnorm(1,sd=0.1))
mydata[[i]] = tgt/sqrt(sum(tgt^2))
}
for (i in 21:30){
tgt = c(stats::rnorm(2, sd=0.1), 1)
mydata[[i]] = tgt/sqrt(sum(tgt^2))
}
myriem = wrap.sphere(mydata)
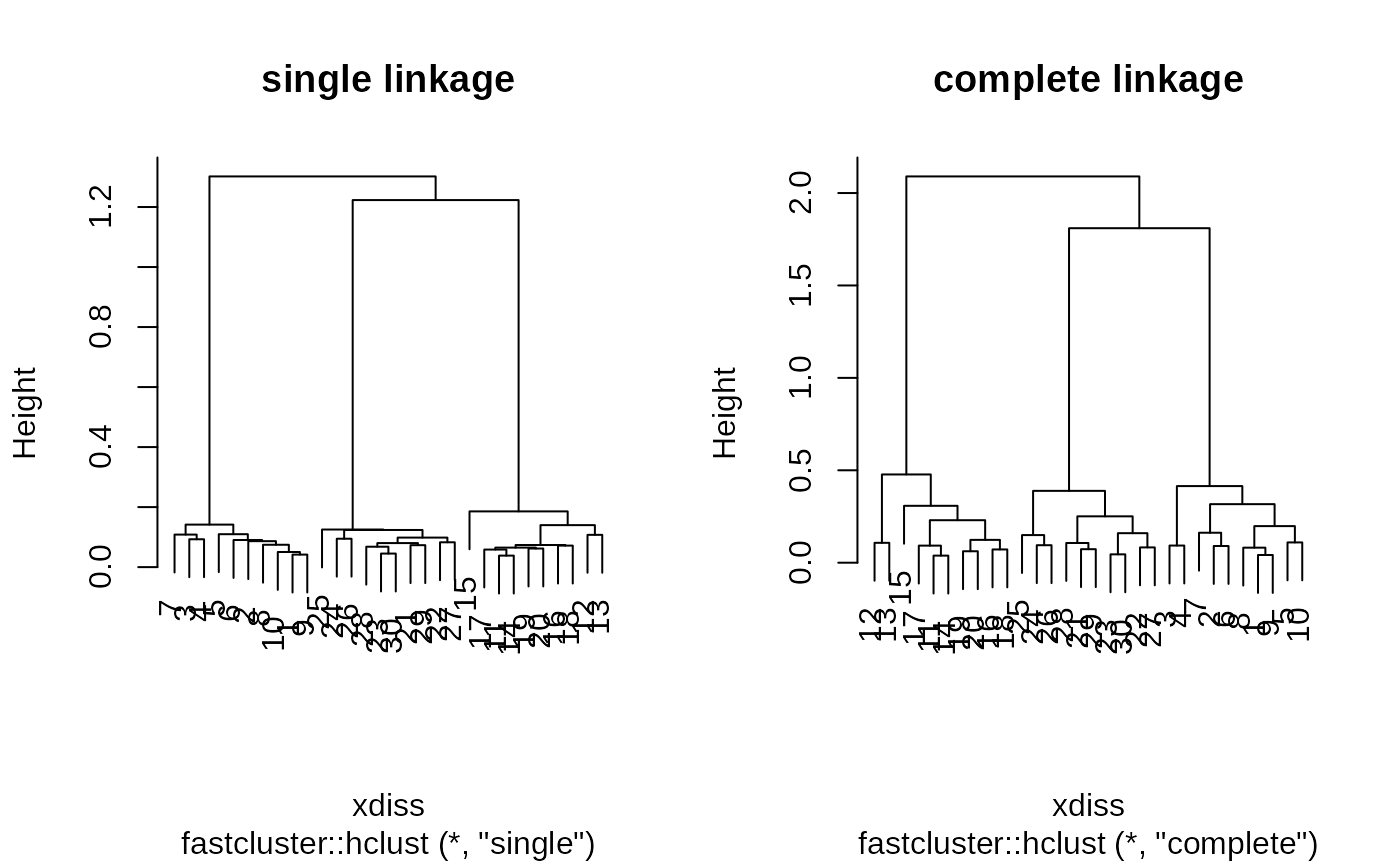
## COMPUTE SINGLE AND COMPLETE LINKAGE
hc.sing <- riem.hclust(myriem, method="single")
hc.comp <- riem.hclust(myriem, method="complete")
## VISUALIZE
opar <- par(no.readonly=TRUE)
par(mfrow=c(1,2))
plot(hc.sing, main="single linkage")
plot(hc.comp, main="complete linkage")
 par(opar)