Barycenter of Histograms
histbary.RdGiven multiple histograms represented as "histogram" S3 objects, compute
their 2-Wasserstein barycenter using the exact 1D quantile characterization.
All input histograms must have identical breaks.
Arguments
- hists
a length-\(N\) list of histograms (
"histogram"objects) of same breaks.- weights
a weight for each histogram; if
NULL(default), uniform weights are used. Otherwise, it should be a length-\(N\) vector of nonnegative weights.- L
number of quantile levels used to approximate the barycenter (default: 2000). Larger
Lgives a more accurate approximation at increased computational cost.
Examples
# \donttest{
#----------------------------------------------------------------------
# Binned from Two Gaussians
#
# EXAMPLE : Very Small Example for CRAN; just showing how to use it!
#----------------------------------------------------------------------
# GENERATE FROM TWO GAUSSIANS WITH DIFFERENT MEANS
set.seed(100)
x = stats::rnorm(1000, mean=-4, sd=0.5)
y = stats::rnorm(1000, mean=+4, sd=0.5)
bk = seq(from=-10, to=10, length.out=20)
# HISTOGRAMS WITH COMMON BREAKS
histxy = list()
histxy[[1]] = hist(x, breaks=bk, plot=FALSE)
histxy[[2]] = hist(y, breaks=bk, plot=FALSE)
# COMPUTE
hh = histbary(histxy)
# VISUALIZE
opar <- par(no.readonly=TRUE)
par(mfrow=c(1,2), pty="s")
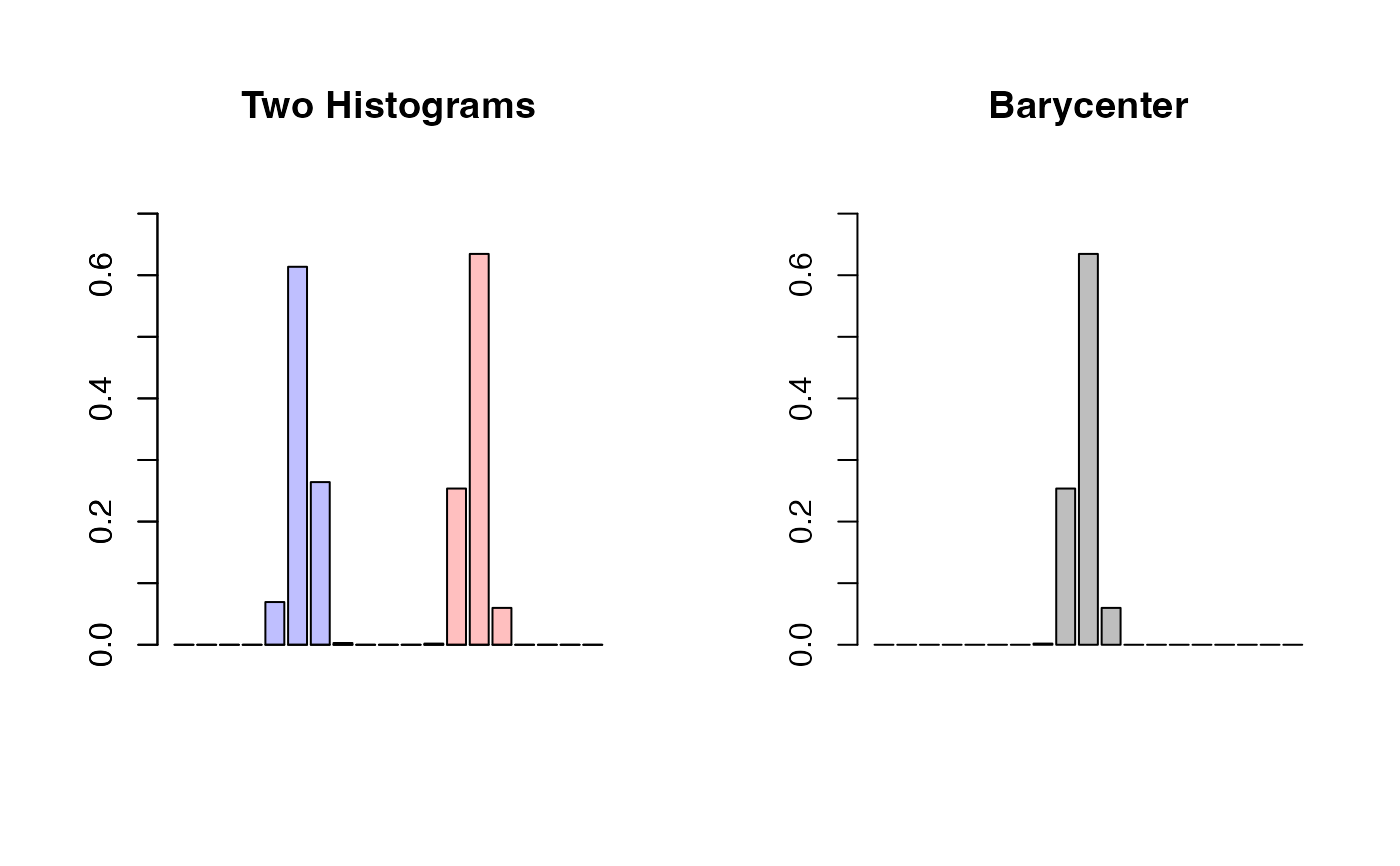
barplot(histxy[[1]]$density, col=rgb(0,0,1,1/4),
ylim=c(0, 0.75), main="Two Histograms")
barplot(histxy[[2]]$density, col=rgb(1,0,0,1/4),
ylim=c(0, 0.75), add=TRUE)
barplot(hh$density, main="Barycenter",
ylim=c(0, 0.75))
 par(opar)
# }
par(opar)
# }